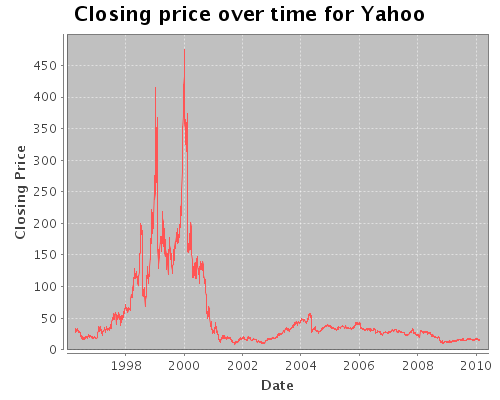
Recently I found myself wanting to plot some time series data and wanted to do this in Clojure. Unfortunately Incanter, a good statistical and graphics library for Clojure, did not provide a way to plot data where the x-axis is a time value. A quick fork on github and a pull request later and now Incanter does. Since I added this functionality I thought I would write up a short example of using it.
The example time series data I’m using I took from Yahoo’s finance section. Here is a link to the csv file I used.
I’m using the read-dataset function provided by Incanter. This procedure reads a delimited file (or URL) and returns an Incanter dataset.
(def yhoo (read-dataset "table.csv" :header true))
Yahoo stores the date in a yyyy-mm-dd format. I need to convert that to milliseconds from the epoch so it can be used in time-series-plot as the x-axis data. To do this I wrote a function which takes the string representation of the date, splits in on “-”, then use the joda-date and to-ms functions from incanter.chrono to get the number of milliseconds from the epoch.
(defn to-milliseconds-from-epoch [x]
  (to-ms
    (apply joda-date (map #(Integer/parseInt %)
                           (.split x "-")))))
Now that we have a function which takes the string representation and get the milliseconds it is time to get the data I want from the dataset. The below code selects the :Close and :Date column while mapping the :Date column to a millisecond from epoch representation of date.
(def mod-data
  (col-names
   (conj-cols
    ($ :Close yhoo)
    ($map to-milliseconds-from-epoch :Date yhoo))
   [:Close :Date]))
The next step is to use the time-series-plot function to actually create the plot. Because the data we have is in a dataset, we can pass in the column names as the x and y parameters and provide the data set as the value to the :data key in the optional parameters.
(def chart (time-series-plot :Date :Close
                             :x-label "Date"
                             :y-label "Closing Price"
                             :title "Closing price over time for Yahoo"
                             :data mod-data))
Then we use the Incanter function view to actually see the chart.
(view chart)
